44. Text + Quiz: Results
CRISP-DM
In working with missing values, categorical variables, and building out your model, it was probably easy to lose sight of the big picture of the process. Let's take a quick second to recap that here, and pull together the results you should have arrived through your analysis.
1. Business Understanding
- How do I break into the field?
- What are the placement and salaries of those who attended a coding bootcamp?
- How well can we predict an individual's salary? What aspects correlate well to salary?
- How well can we predict an individual's job satisfaction? What aspects correlate well to job satisfaction?
2. Data Understanding
Here we used the stackoverflow data to attempt to answer our questions of interest. We did 1. and 2. in tandem in this case, using the data to help us arrive at our questions of interest. This is one of two methods that is common in practice. The second method that is common is to have certain questions you are interested in answering, and then having to collect data related to those questions.
3. Prepare Data
This is commonly denoted as 80% of the process. You saw this especially when attempting to build a model to predict salary, and there was still much more you could have done. From working with missing data to finding a way to work with categorical variables, and we didn't even look for outliers or attempt to find points we were especially poor at predicting. There was ton more we could have done to wrangle the data, but you have to start somewhere, and then you can always iterate.
4. Model Data
We were finally able to model the data, but we had some back and forth with step 3. before we were able to build a model that had okay performance. There still may be changes that could be done to improve the model we have in place. From additional feature engineering to choosing a more advanced modeling technique, we did little to test that other approaches were better within this lesson.
5. Results
Results are the findings from our wrangling and modeling. Below are some questions to recap the results found so far.
SOLUTION:
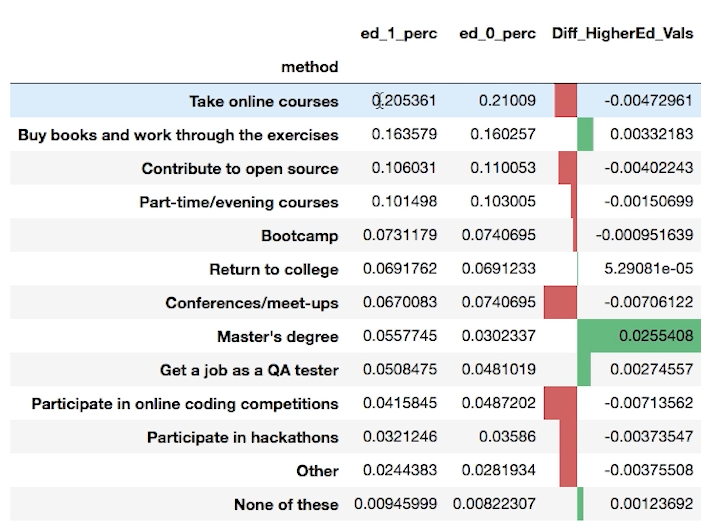
- The largest proportion of individuals suggests breaking into the field by taking online courses.
- There was evidence to suggest that those with higher degrees are more likely to suggest others pursue higher degrees to break into the field.
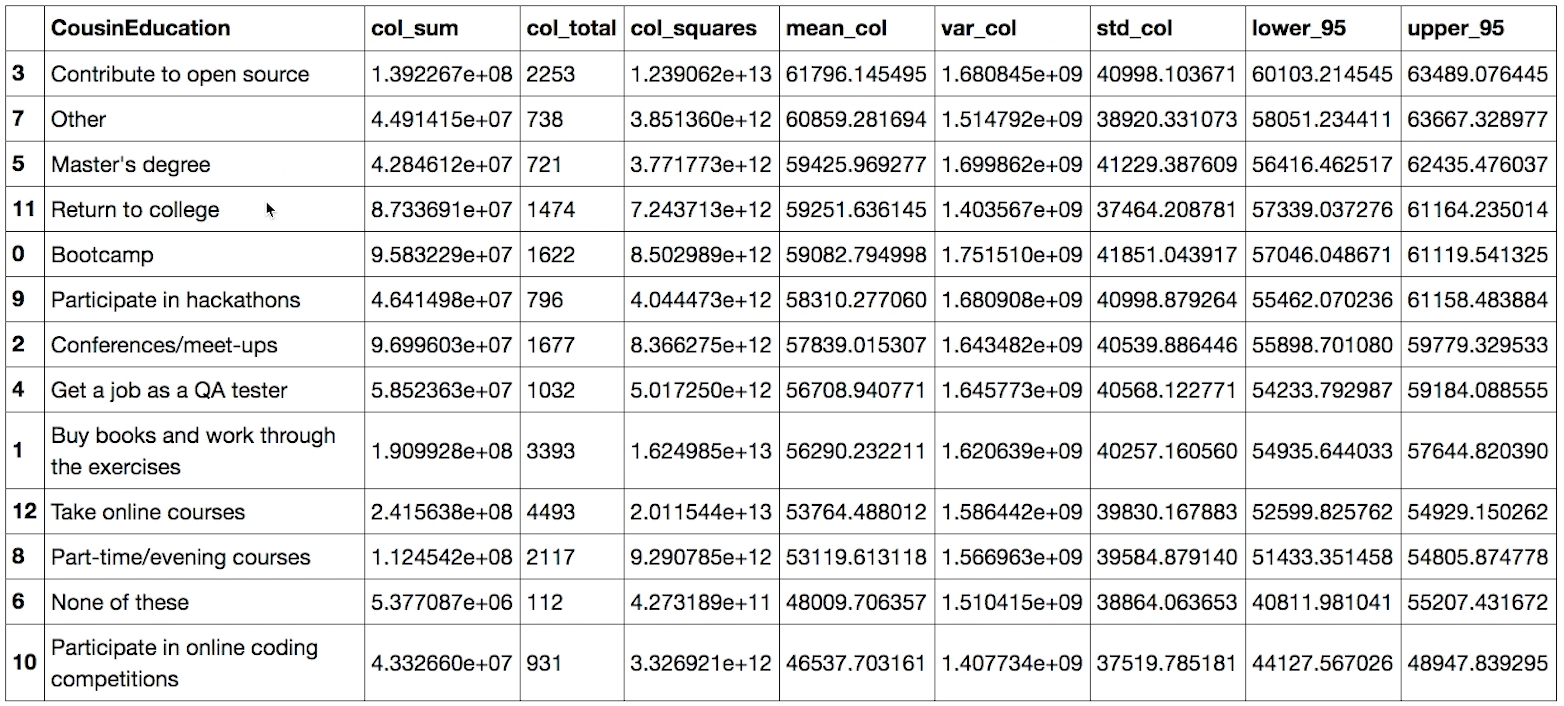
- The average salary was highest for those that suggested contributing to open source as a method to break into the field.

Salary for Bootcamp Graduates in fiat
SOLUTION:
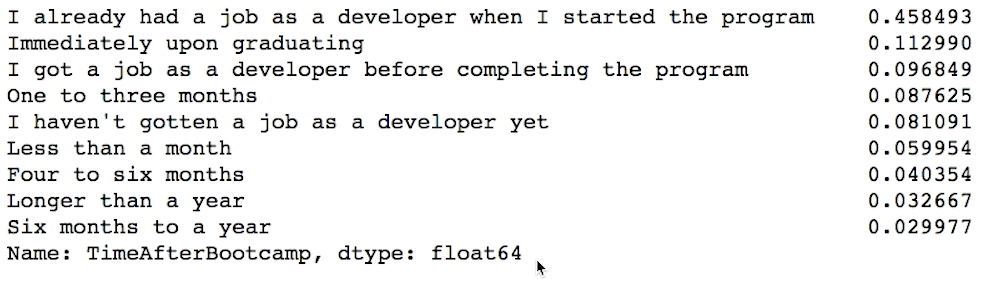
- There was very little that was easily clear about statistics about bootcamp graduates.
SOLUTION:
- It was important to get a model that fit the data well before drawing conclusions.
- We found that where an individual lives is one of the greatest indicators of salary.
- We found that years of experience was one of the greatest indicators of salary.
SOLUTION:
- You encountered errors when working with NaN values.
- You encountered errors when working with categorical variables.
- There are times when you can drop rows or columns, as well as times when you should not.
- Imputing can assist in building models, but often it is important to consider why values are missing to improve models.
- You normalized the features of your X matrix before fitting your model.